Asset intelligence
Model any reporting equipment with its own streams, signals, location, dashboards, alerts, and operating context.
QuantaFlare gives every reporting asset an AI harness: continuous monitoring, contextual analysis, and generative data tools—plus cycle-accurate health and remaining-life intelligence for batteries.
One platform, two kinds of depth
Model any reporting equipment with its own streams, signals, location, dashboards, alerts, and operating context.
Go beyond BMS gauges with cycle-aware health, equivalent full cycles, degradation, efficiency, thermal behavior, and remaining useful life.
From signal to decision
Connect with our edge hardware or your own. QuantaCloud keeps telemetry, asset identity, calculations, alerts, and AI in the same context.
QSense, CAN, Modbus, REST API, or direct streams. Bring our edge or bring yours.
QSense + Direct API 02Live views, history, maps, smart summaries, custom dashboards, and battery calculators.
QuantaCloud 03Monitor with FlareWatch, investigate and generate with FlareBot, then move toward governed action with FlarePilot.
AI harnessInside the Flare AI harness
On-Demand Analysis is the generative workspace inside FlareBot. An operator can ask for it directly, or FlareBot can use it during an investigation. The result is a live plot, table, or analysis surface inside QuantaCloud.
Bulk telemetry stays in the platform data path; the model works from catalog and summary context.
Plot the last 24 hours of voltage with temperature
The battery advantage
Most platforms stop at voltage, current, and the SOC reported by the BMS. QuantaFlare builds cycle history and health intelligence from the telemetry underneath it.
The Flare AI harness
One asset context flows from continuous monitoring through analysis and generation—and, with FlarePilot, toward governed action.
Monitor
Continuously evaluates real-time data for threshold breaches, missing signals, and battery-specific anomalies.
Analyze + generate
Moves with the operator through QuantaCloud, carrying the current unit and stream into every investigation and follow-up.
Act
The future action layer: turning findings into recommended, governed workflows with people in control.
Built around the asset
EV fleets
Connect vehicle location and pack telemetry to trip energy, efficiency, charge behavior, alerts, and remaining life.
Energy storage
Track charge and discharge, roundtrip efficiency, thermal behavior, cell balance, and long-horizon degradation.
Industrial + robotics
Create custom streams for motors, actuators, environment, and power systems—then monitor them beside the battery.
Deploy your way
Start at the edge, connect through the API, operate in the cloud, and keep the fleet in reach on mobile.
QuantaFlare Mobile
See live assets, open a unit, track battery health, and receive FlareWatch alerts from the field.
Get it onGoogle Play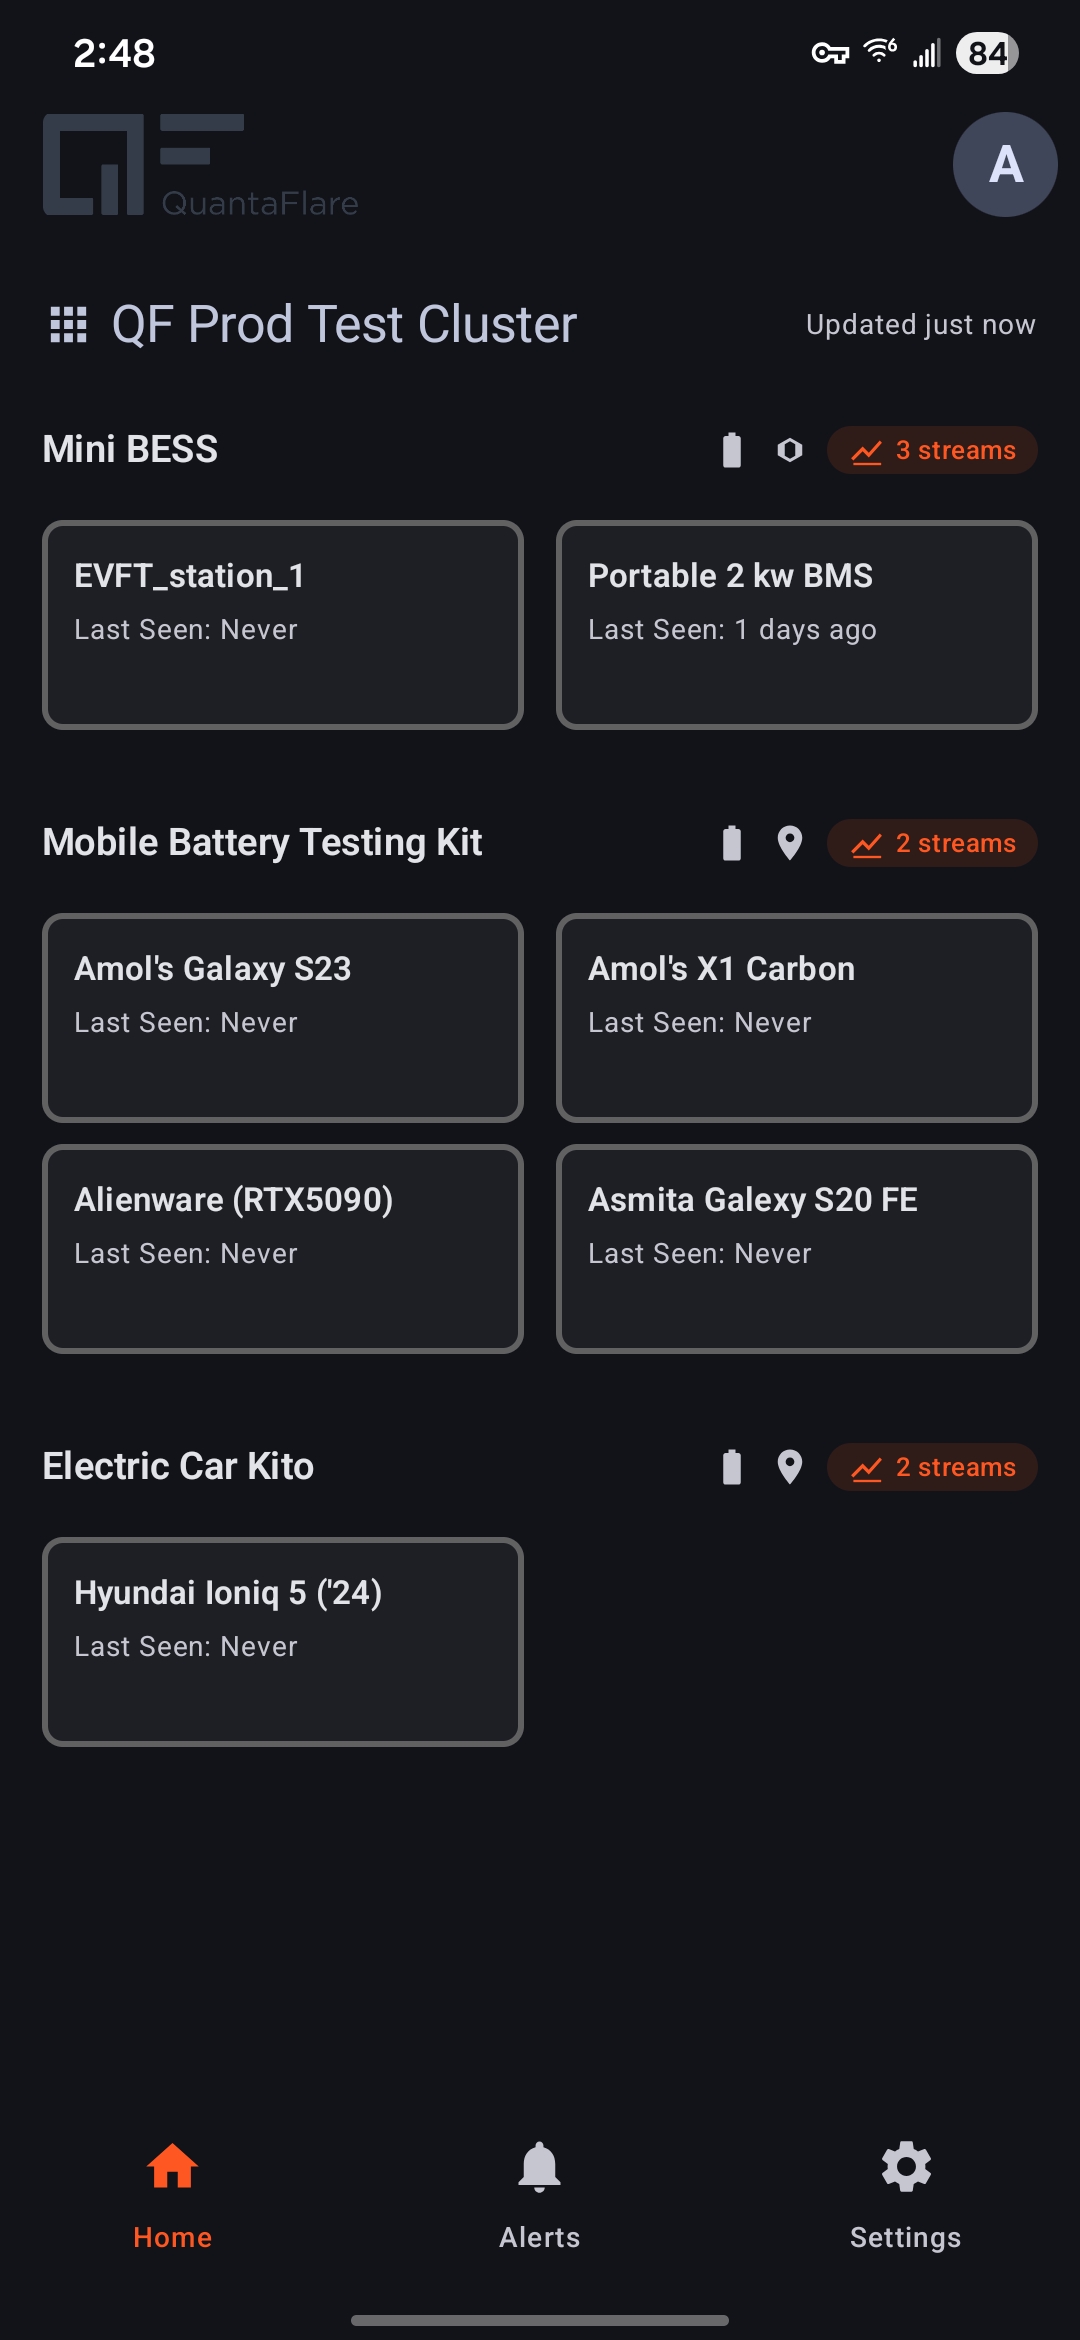
Bring us the messy data
Tell us what reports today, what you wish you knew, and where the team loses time. We’ll walk through the shortest path from telemetry to a useful operating view.